Jeff Chandler from WorePress Tavern recently reported that WordPress Plugin directory has surpassed one billion downloads since March 2006 and he asked readers to estimate when it will reach two billion downloads. Instead of throwing a wild guess, I decided to do some statistical analysis on the data he provided to get a statistical estimate.
Here are the data he provided in his post:
- March 2006 191,567
- 2007 2,845,802
- 2008 15,130,856
- 2009 49,822,116
- 2010 72,342,598
- 2011 108,501,907
- 2012 141,609,682
- 2013 182,236,517
- 2014 241,142,505
- January 2015 to August 2015 186,243,700
The number in 2006 is very small probably because it was when WordPress started to record downloads.
In order to do the statistical analysis, I have to do some data preparation:
I use the amount of months it took to reach the total downloads plus the previous total downloads. So it took 9 months (in 2006) to reach 191,567 downloads and it took 21 months to reach 3,037,369 (191,567 + 2,845,802) downloads, and it took 33 months to reach 18,168,225 (3,037,369 + 15,130,856) downloads, and etc. So I got the data like this:
| Months | DOWNLOADS | LOG_DOWNLOADS |
| 21 | 3037369 | 6.482497556 |
| 33 | 18168225 | 7.2593125 |
| 45 | 67990341 | 7.832447219 |
| 57 | 140332939 | 8.147159621 |
| 69 | 248834846 | 8.395911197 |
| 81 | 390444528 | 8.591559341 |
| 93 | 572681045 | 8.757912809 |
| 105 | 813823550 | 8.910530253 |
| 112 | 1000067250 | 9.000029205 |
When I plot Months vs. DOWNLOADS, I got a figure like this:
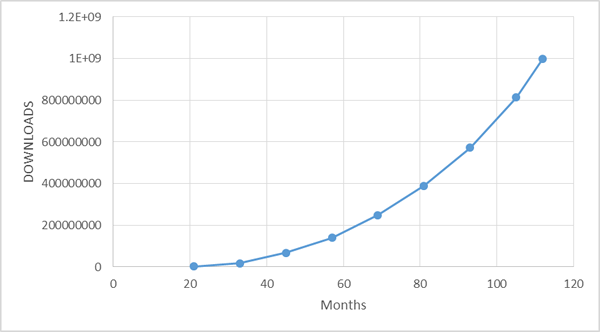
It is clear that the growth of the total downloads is like exponential and in order to do linear regression I need to perform data transformation. So I took base-10 logarithm on DOWNLOADS to get LOG_DOWNLOADS and the results are shown in above table, then I plot Months VS LOG_DOWNLOADS as follows:
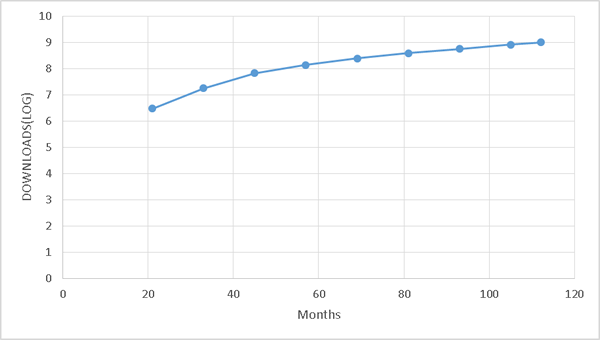
Now we can see a linear relationship between Months and LOG_DOWNLOADS, especially starting from the fourth data point (Months = 57), it is a very good linear trend, so I decided to treat the first three data points as outliers and to drop them( I know in real statistical analysis I cannot drop them, but here I am just trying to simplify things). I used the last six rows of data to perform linear regression analysis and I got the prediction function as follows:
LOG(Y) = 0.015180271X+ 7.32581705
Where Y is the total downloads, and X is the number of months
With this function, we can roughly predict that at the end of the year 2015 (Months = 117), the total downloads will be about 1,264,470,661. To reach 2 billion downloads, it will need 130 months(since March 2006), in another word, it will reach 2 billion downloads in 18 months (January 2017).
So what do you think?